The World Bank’s Global Electrification Database compiles nationally representative household survey data (e.g. LSMS, MTF, DHS) as well as census data. It also incorporates data from the Socio-Economic Database for Latin America and the Caribbean, the Middle East and North Africa Poverty Database, and the Europe and Central Asia Poverty Database, all of which are based on similar surveys. In general, countries publish or update their electricity data at an interval of two to three years in time for global data collection.
Methodology
Data sources
Estimating missing values
Surveys are typically published every two to three years, but they can be irregular and infrequent in many regions. To estimate values, a multilevel, nonparametric modeling approach developed by the World Health Organization to estimate clean fuel usage was adapted to predict electricity access and used to fill in the missing data points for the time period between 1990 and the latest year. Where data are available, access estimates are weighted by population. Multilevel nonparametric modeling takes into account the hierarchical structure of data (country and regional levels), using the regional classification of the United Nations.
The model is applied for all countries with at least one data point. In order to use as much real data as possible, results based on real survey data are reported in their original form for all years available. The statistical model is used to fill in data only for years where they are missing and to conduct global and regional analyses. In the absence of survey data for a given year, information from regional trends was borrowed. The difference between real data points and estimated values is clearly identified in the database.
"High-income” countries defined by the World Bank income classification are assumed to reach universal access for the years the countries belong to the category.
In the present report, to avoid having electrification trends from 1990 to 2010 overshadow efforts since 2010, the model was run twice:
- With survey data + assumptions from 1990 to the latest year for model estimates from 1990 to the latest year
- With survey data + assumptions from 2010 to the latest year for model estimates from 2010 to the latest year
Calculating the annual change in access rate
The annual change in access rate is calculated as the difference between the access rate in year 2 and the rate in year 1, divided by the number of years in order to annualize the value:
(Access Rate Year 2 – Access Rate Year 1) / (Year 2 – Year 1)
Data sources
The WHO Household Energy Database contains regularly updated nationally representative household survey data (WHO 2025). It relies on a number of sources (see table 2.1) and serves in this report as the basis for all modelling efforts (currently using methods from Stoner and others 2020, and before that Bonjour and others 2014;). The database has over 1,600 surveys conducted in 171 countries (including high-income countries) between 1960 and 2023; a quarter of the surveys cover the years 2013 to 2018 and 284 new surveys cover 2016 to 2023. Modelled estimates for low- and middle-income countries are only provided if there is underlying survey data on cooking fuels, so there are no estimates for Lebanon, Libya and Bulgaria.
Population data are from the latest revision of the United Nations World Population Prospects (2024) and World Urbanization Prospects (2018) by the United Nations Population Division.
Model
As household surveys are conducted irregularly and reported heterogeneously, the WHO Global Household Energy Model (developed in collaboration with the University of Exeter, UK and maintained in collaboration with the University of Glasgow, UK) is employed to estimate trends in household use of six fuel types:
- unprocessed biomass (e.g., wood)
- charcoal
- coal
- kerosene
- gaseous fuels (e.g., LPG)
- electricity
Trends in the proportion of the population using each fuel type are estimated using a Bayesian hierarchical model, with urban and rural disaggregation, drawing on country survey data. Smooth functions of time were the only covariate. Estimates for overall ‘polluting’ fuels (unprocessed biomass, charcoal, coal, and kerosene) and ‘clean’ fuels (gaseous fuels, electricity, as well as an aggregation of any other clean fuels like alcohol) are produced by aggregating estimates of relevant fuel types. Estimates produced by the model automatically respect the constraint that the total fuel use equals 100 percent.
GHEM is implemented using the R programming language and the NIMBLE software package for Bayesian modelling with Markov chain Monte Carlo (MCMC). Summaries can be obtained to provide both point estimates (e.g., means) and measures of uncertainty (e.g., 95 percent credible and 95 percent prediction intervals). The GHEM is applied to the WHO household energy database to produce a comprehensive set of estimates, together with associated measures of uncertainty, of the use of four specific polluting fuels and two specific clean fuels for cooking, by country, for each year from 1990 to 2020. Further details on the modelling methodology and validation can be found in Stoner et and others 2020, and more detailed analysis of individual fuel use can be found in Stoner and others 2021. The complete set of estimates can be downloaded from the WHO Global Health Observatory website.
Only surveys with less than 15 percent of the population reporting “missing”, “no cooking” and “other fuels” were included in the analysis. Surveys were also discarded if the sum of all mutually exclusive categories reported was not within 98-102%. Fuel use values were uniformly scaled (divided) by the sum of all mutually exclusive categories excluding “missing”, “no cooking” and “other fuels”. Countries classified by the World Bank as high income in the 2023 fiscal year were assumed to have transitioned to clean household energy. They are therefore reported as 100 percent access to clean fuel and technologies; no fuel-specific estimates were reported for high-income countries. In addition, no estimates were reported for low- and middle-income countries without data suitable for modelling (Bulgaria, Lebanon, and Libya). Modelled specific-fuel estimates were reported for 128 low- and middle-income countries plus three countries with no World Bank income classification (República Bolivariana de Venezuela, Niue, and Cook Islands), and estimates of overall clean fuel use were reported for 195 countries.
Uncertainty intervals
Many of the point estimates we provide here are accompanied by 95 percent uncertainty intervals, which imply a 95 percent chance that the true value lies within the given range. Small annual changes in the point estimate may be statistical noise arising from either the modelling process or survey variability and may therefore not reflect a real variation in the numbers relying on different fuels between years. The uncertainty intervals should therefore be considered when assessing changes in the access rate, or in the use of specific fuels, between years.
Global and regional aggregations
Population data from the 2024 revision of United Nations Population Prospects and the 2018 Revision of World Urbanization Prospects were used to derive the population-weighted regional and global aggregates. Low- and middle-income countries without data were excluded from all aggregate calculations; high-income countries were excluded from aggregate calculation for specific fuels.
Annualized growth rates and future projections
The annualized increase in the access rate is calculated as the difference between the access rate in year 2 and that in year 1, divided by the number of years to annualize the value:
(Access Rate Year 2–Access Rate Year 1) / (Year 2–Year 1)
This approach takes population growth into account by working with the final national access rate. Projected access rates, access deficits, and fuel use can be estimated using the GHEM, where uncertainty increases the further into the future estimates are calculated, reflecting how country trends may shift based on how unsettled they were during the data period.
Projections are hypothetical scenarios in which no new policies or interventions (positive or otherwise) take place, and as such are useful as baseline scenarios for comparing the effect of interventions.
Data sources
The data are derived from the International Energy Agency (IEA) World energy balances, with additional information at https://www.iea.org/reports/sdg7-data-and-projections; and from the United Nations Energy Statistics Database (http://data.un.org/Explorer.aspx?d=EDATA); both providing a breakdown of national energy flows by products over time.
Methodology
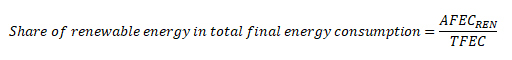
The main indicator (SDG 7.2.1 indicator) used in this report to track the renewables energy target is the share of renewable energy in total final energy consumption (TFEC) and is expressed as a percentage (%RENTFEC).
Main indicator: Share of renewable energy in total final energy consumption (in percentage)
This share is calculated as the ratio of final energy consumption from renewables after allocation of electricity and heat (AFECREN) to TFEC, calculated from the flows in the energy balances.
Where:
- Final energy consumption after allocation of electricity and heat (AFEC) (in TJ)
The final energy consumption after allocation of electricity and heat represents the final energy consumption from renewables after allocation of electricity and heat. Final consumption of electricity and heat is allocated to renewables based on the share of the gross generation coming from renewable sources. In practice, this occurs by calculating the % share of electricity and heat produced by each renewable source, multiplying the final energy consumption of electricity and heat by those shares, and then allocating the resulting quantities to each renewable energy source’s final consumption. For instance, if total final consumption table reports 150 TJ for biogas energy, while total final consumption of electricity is 400 TJ and heat 100 TJ, and the share of biogas in total electricity output is 10 percent and 5 percent in heat, the total reported number for biogas consumption will be 195 TJ (150 TJ+400TJ*10%+100TJ*5%). As a result of this method, it is implicitly assumed that energy losses between energy supplied and energy consumed are proportional to their shares in production across all technologies.
- Total final energy consumption (TFEC) (in TJ)
Total final energy consumption represents the sum of the energy from all sources used in the industry, transport, buildings, and other sectors of final consumption. It is derived from the national energy balance and excludes quantities used for non-energy purposes.
- Renewable energy
Renewable energy includes hydro, solid biofuels, liquid biofuels, biogases, wind, solar, geothermal, tide/wave/oceans and renewable municipal waste.
Solid biofuels - It includes the following categories in International Energy Agency (IEA) statistics: primary solid biofuels and charcoal. It includes the following categories in UNSD statistics: fuelwood, charcoal, animal waste, black liquor, other vegetal material and residues, and renewable municipal waste (taken as 50% of total municipal waste as a proxy).
Note: Consumption of solid biofuels at national level is often estimated due to the difficulty of properly measuring it.
Traditional use of biomass - It refers to the energy use of local solid biomass resources by low-income households that do not have access to modern cooking and heating fuels or technologies. Solid biomass, such as wood, charcoal, agricultural residues and animal dung, is converted into energy through basic techniques, such as a three-stone fire, for heating and cooking in the residential sector, which is often inefficient and associated with negative impacts on human health and the environment. For the purposes of this report, the traditional use of biofuels is assumed to occur in the residential sector in non-Organisation for Economic Co-operation and Development (OECD) countries excluding Eurasia.
Modern biomass – For the purposes of this report, despite the lack of an agreed statistical definition for "modern biomass", it is considered as all liquid and gaseous biomass consumed directly for energy (and not to generate other forms of commercial energy such as electricity and district heat), as well as solid biomass consumed directly in modern applications, such as in industrial processes, boilers and other applications. In this report, all solid biomass consumed directly in OECD countries is assumed to be modern while for non-OECD countries excluding Eurasia, only the part that is not used in households is assumed to be modern.
- Modern renewable energy
For the purposes of this report, it refers to the total renewable energy consumption minus the traditional use of biomass.
Data sources
The energy data are derived from the International Energy Agency (IEA) World Energy Balances (https://www.iea.org/data-and-statistics); and from the United Nations Energy Statistics Database (http://data.un.org/Explorer.aspx?d=EDATA). GDP data are primarily sourced from the International Monetary Fund (IMF) World Economic Outlook database, complemented with data from the World Bank World Development Indicators and the CEPII CHELEM databases.
Methodology
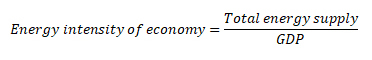
The main indicator (SDG 7.3.1 indicator) used in this report to track the efficiency target is the energy intensity of the economy, computed as ratio between total energy supply (in MJ) and gross domestic product (GDP), measured at purchasing power parity at constant 2021 US dollars.
Energy intensity is an imperfect proxy for energy efficiency. It can be affected by a number of factors, such as climate, structure of the economy, nature of economic activities, etc. - which are not necessarily linked to pure efficiency improvements.
Main indicator: energy intensity of the economy, computed as energy supplied to the economy per unit value of economic output (in megajoules [MJ] per USD 2021 at purchasing power parity [2021 PPP$])
Where:
- Total energy supply (TES) (in MJ)
The total energy supply represents the amount of energy that is available in the national territory during the reference period. It is defined by the International Recommendations for Energy Statistics (IRES, https://unstats.un.org/unsd/energystats/methodology/ires/ ) as:
Total energy supply =
Primary energy production
+ Import of primary and secondary energy
- Export of primary and secondary energy
- International (aviation and marine) bunkers
- Stock changes.
- Gross domestic product (GDP) (in 2021 PPP$)
GDP is the sum of gross value added in all the sectors of an economy plus any product taxes and minus any subsidies not included in the value of the products. It is calculated without making deductions for depreciation of fabricated assets or for depletion and degradation of natural resources. GDP is measured at purchasing power parity at constant 2021 US dollars.
- Compound annual growth rate (CAGR) (in percentage)
The compound annual growth rate (CAGR) represents the average annual growth rate during a period of time. Negative values represent improvements in energy intensity (less energy is used to produce one unit of economic output), while positive values indicate worsening (more energy is used to produce one unit of economic output).
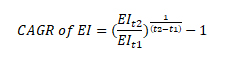
Where:
EIt1: energy intensity in year t1
EIt2: energy intensity in year t2
Data sources
IRENA’s electricity capacity database contains information about the electricity generating capacity installed at the year-end, measured in megawatt (MW). The dataset covers all countries and areas from the year 2000 onwards. The dataset also records whether the capacity is on-grid or off-grid and is split into 36 different renewable energy types that can be aggregated into the six main sources of renewable energy.
For the population part of this indicator, IRENA uses population data from the United Nations World Population Prospects. The population data reflects the residents in a country or area regardless of legal status or citizenship. The values are midyear estimates.
The United Nations Department of Economic and Social Affairs published information about their its methodology on the following link: https://population.un.org/wpp/Methodology/
Methodology
The capacity data are collected as part of IRENA’s annual questionnaire cycle. Questionnaires are sent to countries at the start of a year asking for renewable energy data for two years previously (i.e. at the start of 2019, questionnaires ask for data for the year 2017). The data are then validated and checked with countries and published in the IRENA Renewable Energy Statistics Yearbook at the end of June. To minimise reporting burden, the questionnaires for some countries are pre-filled with data collected by other agencies (e.g. Eurostat) and are sent to countries for them to complete any additional details requested by IRENA.
At the same time as this, preliminary estimates of capacity for the previous year are also collected from official sources where available (e.g. national statistics, data from electricity grid operators) and from other unofficial sources (mostly industry associations for the different renewable energy sectors). These are published at the end of March.
For each country and year, the renewable electricity generating capacity at the end of the year is divided by the total population of the country as of mid-year (July 1st).
More detail on the methodology can be found in the SDG indicators metadata repository: https://unstats.un.org/sdgs/metadata/files/Metadata-07-0b-01.pdf
Data sources
From the OECD, official development assistance (ODA) and other official flows (OOF) to developing countries together comprise the public financial support that donors provide to developing countries for renewable energy. These flows are defined as the sum of official loans, grants, and equity investments that “DAC countries” (ODA recipients listed by the Development Assistance Committee) receive from foreign governments and multilateral agencies for clean energy research to develop and produce renewable energy (including in hybrid systems). The OECD consolidates and categorises these figures as self-reported by donors; these figures are extracted from the OECD/DAC Creditor Reporting System (CRS) as bulk downloads starting in the year 2000 and then filtered to reflect public investments in clean energy by excluding commitments with blanks or zeroes. Then, purpose codes are filtered to include clean energy investments.
Finally, private donor flows (mostly philanthropic organizations) are removed from the data (https://stats.oecd.org/Index.aspx?DataSetCode=crs1).
Methodology
The SDG 7.a.1 uses a combination of two databases to account for international public financial flows. First, the OECD/DAC Creditor Reporting System (CRS) database from the OECD. Then the Renewable Energy Public Finance Database from IRENA.
The flows covered by IRENA are defined as all additional loans, grants and equity investments received by developing countries from all foreign governments, multilateral agencies and additional DFIs (including export credits, where available) for the purpose of clean energy research and development and renewable energy production, including in hybrid systems. These additional flows cover the same technologies and other activities (research and development, technical assistance, renewable electricity distribution infrastructure, and so forth) as listed above and, to avoid duplication of data, exclude all flows extracted from the CRS.